proc文件系统中可以查看一些正在运行的变量如device-tree
sh-3.2# cat /proc/device-tree/
#address-cells               fixedregulator@9/
#size-cells                  gpio-keys/
atf_logger/                  interrupt-parent chosen/                      lcm/
clocks/                      mediatek,connectivity-combo/
compatible memory@00000000/
cpus/                        model
cust_accel@0/                mt8167_audio_codec/
cust_gyro@0/                 mtcpufreq/
cust_mag@0/                  name
ethernet@11180000/           opp_table0/
fixedregulator@0/ panel@0/
fixedregulator@1/            pmu/
fixedregulator@10/           psci/
fixedregulator@11/           reserved-memory/
fixedregulator@12/           sdio@11130000/
fixedregulator@2/            soc/
fixedregulator@4/ sound/
fixedregulator@5/            timer/
fixedregulator@6/            tlv320/
fixedregulator@7/            tonly-power-leds/
fixedregulator@8/            vibrator@0/
sh-3.2# cat /proc/device-tree/gpio-keys/ button@0/ button@2/ button@4/      name           pinctrl-names button@1/ button@3/      compatible     pinctrl-0 sh-3.2# cat /proc/device-tree/gpio-keys/compatible
gpio-keys sh-3.2#
-
1
-
2
-
3
-
4
-
5
-
6
-
7
-
8
-
9
-
10
-
11
-
12
-
13
-
14
-
15
-
16
-
17
-
18
-
19
-
20
-
21
-
22
-
23
-
24
-
25
-
26
-
27
-
28
module_param值修改方法
module_param(musbfsh_debug, int, 0644);
修改方法
echo 1 > sys/module/musbfsh_core/parameters/musbfsh_debug
编译时判断宏变量是否定义:编译时打印宏变量
#ifdef CONFIG_DWMAC_MESON #pragma message("CONFIG_DWMAC_MESON active\n") 编译的时候的打印会有提示,搜索即可:
note: #pragma message:  CONFIG_DWMAC_MESON active #pragma message("CONFIG_DWMAC_MESON active\n")
重定义打印宏,显示特定打印结构
#ifdef pr_debug #undef pr_debug #define pr_debug(fmt, ...) \ printk(KERN_INFO pr_fmt(fmt), ##__VA_ARGS__) #else #define pr_debug(fmt, ...) \ printk(KERN_INFO pr_fmt(fmt), ##__VA_ARGS__) #endif
有格式的打印,便于分析别人代码
#ifdef pr_debug #undef pr_debug #define pr_debug(fmt,...) printk(KERN_INFO"%s:%s :%d\n "fmt, __FILE__ , __FUNCTION__ , __LINE__ , ##__VA_ARGS__) #else #define pr_debug(fmt, ...) printk(KERN_INFO pr_fmt(fmt), ##__VA_ARGS__) #endif
1) VA_ARGS 是一个可变参数的宏,很少人知道这个宏,这个可变参数的宏是新的C99规范中新增的,目前似乎只有gcc支持(VC6.0的编译器不支持)。宏前面加上##的作用在于,当可变参数的个数为0时,这里的##起到把前面多余的”,”去掉的作用,否则会编译出错, 你可以试试。
2) FILE 宏在预编译时会替换成当前的源文件名
3) LINE宏在预编译时会替换成当前的行号
4) FUNCTION宏在预编译时会替换成当前的函数名称
#ifndef _OSD_LOG_H_ #define _OSD_LOG_H_ #include  #include  #define OSD_LOG_LEVEL_NULL 0 #define OSD_LOG_LEVEL_DEBUG 1 #define OSD_LOG_LEVEL_DEBUG2 2 #define OSD_LOG_LEVEL_DEBUG3 3 extern unsigned int osd_log_level; #undef pr_fmt #define pr_fmt(fmt) KBUILD_MODNAME ": " fmt #define osd_log_info(fmt, ...) \ pr_info(fmt, ##__VA_ARGS__) #define osd_log_err(fmt, ...) \ pr_err(fmt, ##__VA_ARGS__) #define osd_log_dbg(fmt, ...) \ do { \ if (osd_log_level >= OSD_LOG_LEVEL_DEBUG) { \
            pr_info(fmt, ##__VA_ARGS__); \ } \
    } while (0) #define osd_log_dbg2(fmt, ...) \ do { \ if (osd_log_level >= OSD_LOG_LEVEL_DEBUG2) { \
            pr_info(fmt, ##__VA_ARGS__); \ } \
    } while (0) #define osd_log_dbg3(fmt, ...) \ do { \ if (osd_log_level >= OSD_LOG_LEVEL_DEBUG3) { \
            pr_info(fmt, ##__VA_ARGS__); \ } \
    } while (0) #endif
-
1
-
2
-
3
-
4
-
5
-
6
-
7
-
8
-
9
-
10
-
11
-
12
-
13
-
14
-
15
-
16
-
17
-
18
-
19
-
20
-
21
-
22
-
23
-
24
-
25
-
26
-
27
-
28
-
29
-
30
-
31
-
32
-
33
-
34
-
35
-
36
-
37
-
38
-
39
-
40
-
41
-
42
-
43
-
44
-
45
通过menuconfig配置将打印打开:
+CONFIG_DEBUG_OBJECTS=y +CONFIG_DEBUG_OBJECTS_TIMERS=y +CONFIG_DEBUG_OBJECTS_WORK=y +CONFIG_SLUB_DEBUG_ON=y +CONFIG_DEBUG_STACK_USAGE=y +CONFIG_DEBUG_MEMORY_INIT=y +CONFIG_DEBUG_PER_CPU_MAPS=y +CONFIG_DEBUG_SHIRQ=y +CONFIG_LOCKUP_DETECTOR=y +CONFIG_BOOTPARAM_HARDLOCKUP_PANIC=y +CONFIG_BOOTPARAM_SOFTLOCKUP_PANIC=y +CONFIG_BOOTPARAM_HUNG_TASK_PANIC=y +CONFIG_PANIC_ON_OOPS=y +CONFIG_DEBUG_KOBJECT=y +CONFIG_DEBUG_DRIVER=y
-
1
-
2
-
3
-
4
-
5
-
6
-
7
-
8
-
9
-
10
-
11
-
12
-
13
-
14
-
15
将会有更细节的打印:功能都在菜单的kernel hacking里
<7>[ 2.625859@0] kobject: 'rtc-hym8563' (ffffffc0246c78c0): kobject_uevent_env
<7>[ 2.625876@0] kobject: 'rtc-hym8563' (ffffffc0246c78c0): fill_kobj_path: path = '/bus/i2c/drivers/rtc-hym8563' <7>[ 2.626050@0] bus: 'amba': add driver rtc-pl031
<7>[ 2.626066@0] kobject: 'rtc-pl031' (ffffffc0246c66c0): kobject_add_internal: parent: 'drivers', set: 'drivers' <7>[ 2.626121@0] kobject: 'rtc-pl031' (ffffffc0246c66c0): kobject_uevent_env
<7>[ 2.626136@0] kobject: 'rtc-pl031' (ffffffc0246c66c0): fill_kobj_path: path = '/bus/amba/drivers/rtc-pl031' <6>[ 2.626267@0] i2c /dev entries driver
<7>[ 2.629519@0] device class 'i2c-dev': registering
<7>[ 2.629534@0] kobject: 'i2c-dev' (ffffffc0244bc398): kobject_add_internal: parent: 'class', set: 'class' <7>[ 2.629555@0] kobject: 'i2c-dev' (ffffffc0244bc398): kobject_uevent_env
<7>[ 2.629568@0] kobject: 'i2c-dev' (ffffffc0244bc398): fill_kobj_path: path = '/class/i2c-dev' <7>[ 2.629724@0] device: 'i2c-2': device_add
<7>[ 2.629737@0] kobject: 'i2c-dev' (ffffffc0246f5200): kobject_add_internal: parent: 'i2c-2', set: '(null)'
-
1
-
2
-
3
-
4
-
5
-
6
-
7
-
8
-
9
-
10
-
11
-
12
-
13
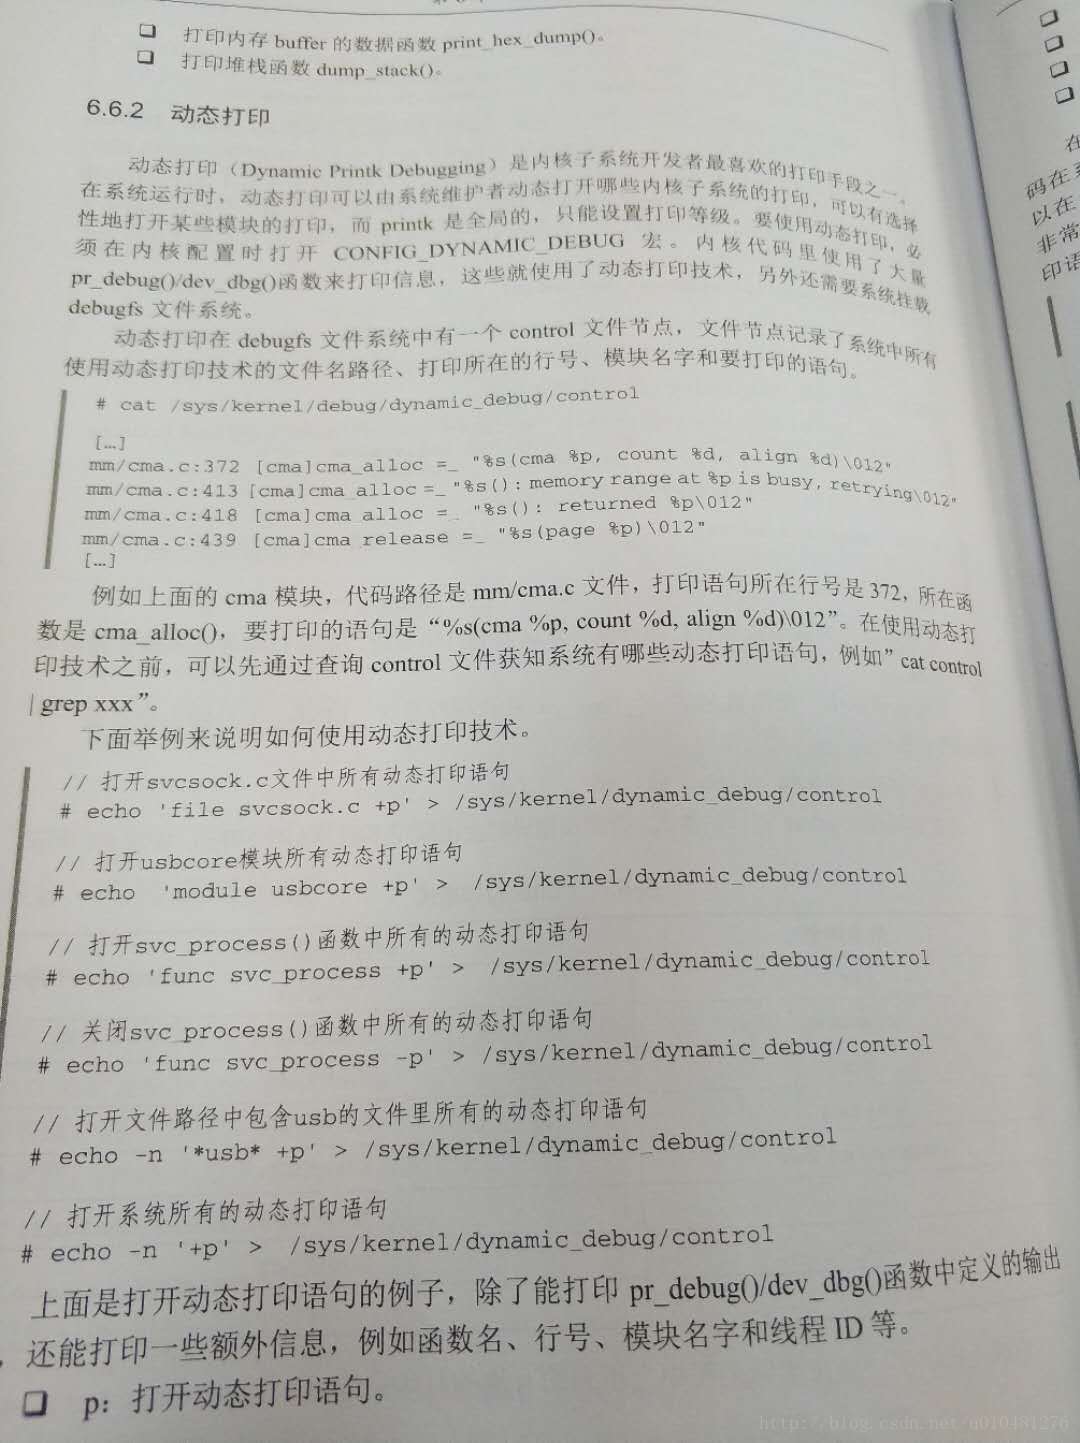
打开pr_debug的打印,修改打印级别:
kernel/printk/printk.c #define DEFAULT_CONSOLE_LOGLEVEL 8 /* anything MORE serious than KERN_DEBUG */ 或在include/linux/printk.h中打开宏,则系统增加全局pr_debug打印 #define DEBUG
利用动态打印,在内核中添加配置,并重新编译烧录内核
CONFIG_DYNAMIC_DEBUG=y
在文件系统中生成如下节点
/sys/kernel/debug/dynamic_debug/control
查看支持的动态调试选项
/sys/kernel/debug/dynamic_debug init/main.c:712 [main]initcall_blacklist =p "blacklisting initcall %s\012" init/main.c:736 [main]initcall_blacklisted =p "initcall %s blacklisted\012" init/initramfs.c:483 [initramfs]unpack_to_rootfs =_ "Detected %s compressed data\012" arch/arm/vfp/vfpmodule.c:456 [vfp]vfp_pm_suspend =_ "%s: saving vfp state\012" arch/arm/vfp/vfpmodule.c:304 [vfp]vfp_emulate_instruction =_ "VFP: emulate: INST=0x%08x SCR=0x%08x\012" arch/arm/vfp/vfpmodule.c:260 [vfp]vfp_raise_exceptions =_ "VFP: raising exceptions %08x\012" arch/arm/vfp/vfpmodule.c:340 [vfp]VFP_bounce =_ "VFP: bounce: trigger %08x fpexc %08x\012" arch/arm/vfp/vfpsingle.c:51 [vfp]vfp_single_dump =_ "VFP: %s: sign=%d exponent=%d significand=%08x\012" arch/arm/vfp/vfpsingle.c:849 [vfp]vfp_single_multiply =_ "VFP: swapping M <-> N\012" arch/arm/vfp/vfpsingle.c:694 [vfp]vfp_single_ftosi =_ "VFP: ftosi: d(s%d)=%08x exceptions=%08x\012" arch/arm/vfp/vfpsingle.c:615 [vfp]vfp_single_ftoui =_ "VFP: ftoui: d(s%d)=%08x exceptions=%08x\012" arch/arm/vfp/vfpsingle.c:145 [vfp]__vfp_single_normaliseround =_ "VFP: rounding increment = 0x%08x\012" arch/arm/vfp/vfpsingle.c:1059 [vfp]vfp_single_fdiv =_ "VFP: s%u = %08x\012" arch/arm/vfp/vfpsingle.c:996 [vfp]vfp_single_fnmul =_ "VFP: s%u = %08x\012" arch/arm/vfp/vfpsingle.c:1020 [vfp]vfp_single_fadd =_ "VFP: s%u = %08x\012" arch/arm/vfp/vfpsingle.c:973 [vfp]vfp_single_fmul =_ "VFP: s%u = %08x\012" arch/arm/vfp/vfpsingle.c:902 [vfp]vfp_single_multiply_accumulate =_ "VFP: s%u = %08x\012" arch/arm/vfp/vfpsingle.c:916 [vfp]vfp_single_multiply_accumulate =_ "VFP: s%u = %08x\012"
-
1
-
2
-
3
-
4
-
5
-
6
-
7
-
8
-
9
-
10
-
11
-
12
-
13
-
14
-
15
-
16
-
17
-
18
-
19
-
20
如下操作,使能对应的打印
echo -n 'file svcsock.c line 1603 +p' > /dynamic_debug/control 打开某个文件某一行的日志
// enable all the messages in file svcsock.c 打开某个文件的所有日志
nullarbor:~ # echo -n 'file svcsock.c +p' > /dynamic_debug/control
// enable all the messages in the NFS server module 打开某个模块的所有日志
nullarbor:~ # echo -n 'module nfsd +p' > /dynamic_debug/control
// enable all 12 messages in the function svc_process() 打开某个函数的所有日志
nullarbor:~ # echo -n 'func svc_process +p' > /dynamic_debug/control
// disable all 12 messages in the function svc_process() 关闭某个文件的所有日志
nullarbor:~ # echo -n 'func svc_process -p' > /dynamic_debug/control
// enable messages for NFS calls READ, READLINK, READDIR and READDIR+.
nullarbor:~ # echo -n 'format "nfsd: READ" +p' > /dynamic_debug/control
-
1
-
2
-
3
-
4
-
5
-
6
-
7
-
8
-
9
-
10
-
11
-
12
-
13
-
14
-
15
-
16
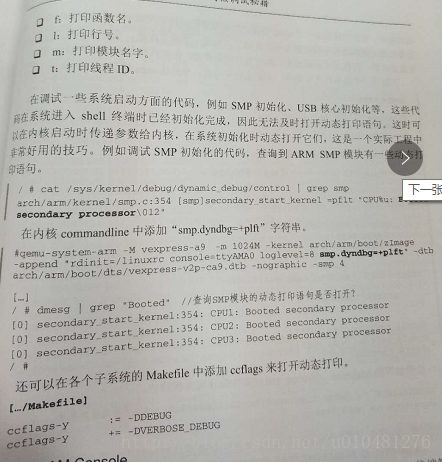
在对应的Makefile里添加
ccflags-y += -DDEBUG ccflags-y += -DVERBOSE_DEBUG
Android debug stack:
Java代码中插入堆栈打印的方法如下:
Log.d(TAG,Log.getStackTraceString(new Throwable()));
C++也是支持异常处理的,异常处理库中,已经包含了获取backtrace的接口,Android也是利用这个接口来打印堆栈信息的。在Android的C++中,已经集成了一个工具类CallStack,在libutils.so中。使用方法:
... CallStack stack;
stack.update();
stack.dump();
C代码中打印堆栈
C代码,尤其是底层C库,想要看到调用的堆栈信息,还是比较麻烦的。 CallStack肯定是不能用,一是因为其实C++写的,需要重新封装才能在C中使用,二是底层库反调上层库的函数,会造成链接器循环依赖而无法链接。不过也不是没有办法,可以通过android工具类CallStack实现中使用的unwind调用及符号解析函数来处理。
这里需要注意的是,为解决链接问题,最好使用dlopen方式,查找需要用到的接口再直接调用,这样会比较简单。如下为相关的实现代码,只需要在要打印的文件中插入此部分代码,然后调用getCallStack()即可,无需包含太多的头文件和修改Android.mk文件:
#define MAX_DEPTH 31 #define MAX_BACKTRACE_LINE_LENGTH 800 #define PATH "/system/lib/libcorkscrew.so" typedef ssize_t (*unwindFn)(backtrace_frame_t*, size_t, size_t); typedef void (*unwindSymbFn)(const backtrace_frame_t*, size_t, backtrace_symbol_t*); typedef void (*unwindSymbFreeFn)(backtrace_symbol_t*, size_t); static void *gHandle = NULL; static int getCallStack(void){
ssize_t i = 0;
ssize_t result = 0;
ssize_t count;
backtrace_frame_t mStack[MAX_DEPTH];
backtrace_symbol_t symbols[MAX_DEPTH];
unwindFn unwind_backtrace = NULL;
unwindSymbFn get_backtrace_symbols = NULL;
unwindSymbFreeFn free_backtrace_symbols = NULL; if(gHandle == NULL) gHandle = dlopen(PATH, RTLD_NOW); if(gHandle != NULL) unwind_backtrace = (unwindFn)dlsym(gHandle, "unwind_backtrace"); if(gHandle != NULL) get_backtrace_symbols = (unwindSymbFn)dlsym(gHandle, "get_backtrace_symbols"); if(gHandle != NULL) free_backtrace_symbols = (unwindSymbFreeFn)dlsym(gHandle, "free_backtrace_symbols"); if(!gHandle ||!unwind_backtrace ||!get_backtrace_symbols || !free_backtrace_symbols ){
ALOGE("Error! cannot get unwind info: handle:%p %p %p %p",
gHandle, unwind_backtrace, get_backtrace_symbols, free_backtrace_symbols ); return result;
}
count= unwind_backtrace(mStack, 1, MAX_DEPTH);
get_backtrace_symbols(mStack, count, symbols); for (i = 0; i < count; i++) { char line[MAX_BACKTRACE_LINE_LENGTH]; const char* mapName = symbols[i].map_name ? symbols[i].map_name : ""; const char* symbolName =symbols[i].demangled_name ? symbols[i].demangled_name : symbols[i].symbol_name;
size_t fieldWidth = (MAX_BACKTRACE_LINE_LENGTH - 80) / 2; if (symbolName) {
uint32_t pc_offset = symbols[i].relative_pc - symbols[i].relative_symbol_addr; if (pc_offset) {
snprintf(line, MAX_BACKTRACE_LINE_LENGTH, "#%02d pc %08x %.*s (%.*s+%u)",
i, symbols[i].relative_pc, fieldWidth, mapName,
fieldWidth, symbolName, pc_offset);
} else {
snprintf(line, MAX_BACKTRACE_LINE_LENGTH, "#%02d pc %08x %.*s (%.*s)",
i, symbols[i].relative_pc, fieldWidth, mapName,
fieldWidth, symbolName);
}
} else {
snprintf(line, MAX_BACKTRACE_LINE_LENGTH, "#%02d pc %08x %.*s",
i, symbols[i].relative_pc, fieldWidth, mapName);
}
ALOGD("%s", line);
}
free_backtrace_symbols(symbols, count); return result;
}
-
1
-
2
-
3
-
4
-
5
-
6
-
7
-
8
-
9
-
10
-
11
-
12
-
13
-
14
-
15
-
16
-
17
-
18
-
19
-
20
-
21
-
22
-
23
-
24
-
25
-
26
-
27
-
28
-
29
-
30
-
31
-
32
-
33
-
34
-
35
-
36
-
37
-
38
-
39
-
40
-
41
-
42
-
43
-
44
-
45
-
46
-
47
-
48
-
49
-
50
-
51
-
52
-
53
-
54
-
55
-
56
-
57
-
58
-
59
-
60
-
61
-
62
-
63
-
64
-
65
-
66
-
67
-
68
死机问题:
访问已经释放的内存
重复释放已释放的内存
越界访问
打开内核选项:
CONFIG_SLUB_DEBUG_ON
CONFIG_SLUB_DEBUG
